The other day at PHE we were investigating use of MASH sketches to find closest isolates. If you don’t already know about MASH, it’s a MinHash algorithm implemented by Adam Phillippy’s group (@aphillippy). It is fast and pretty neat, but the resulting distance is directly related to the errors in the sequencing. On one hand, you want to minimise erroneous kmers that result as a function of sequencing, but keep kmers of relatively high abundance. But how do you get that sweetspot?
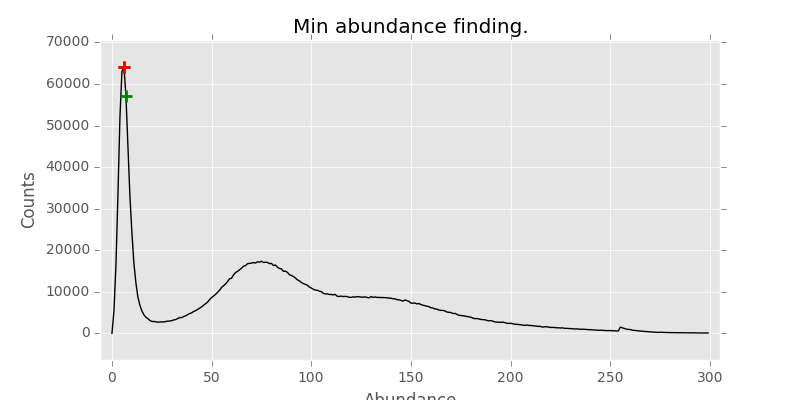
Enter khmer from from Titus Brown lab (@ctitusbrown). It is a set of tools to work with kmers and other data. One of the things it does is calculates the abundance of kmers as a histogram and it looks something like this (-k 21):
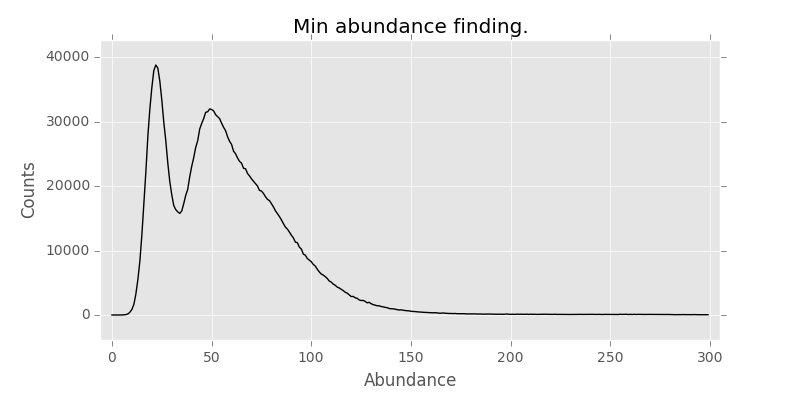
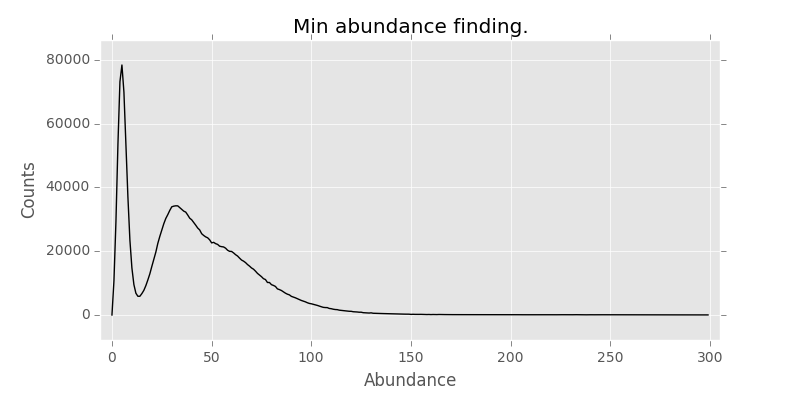
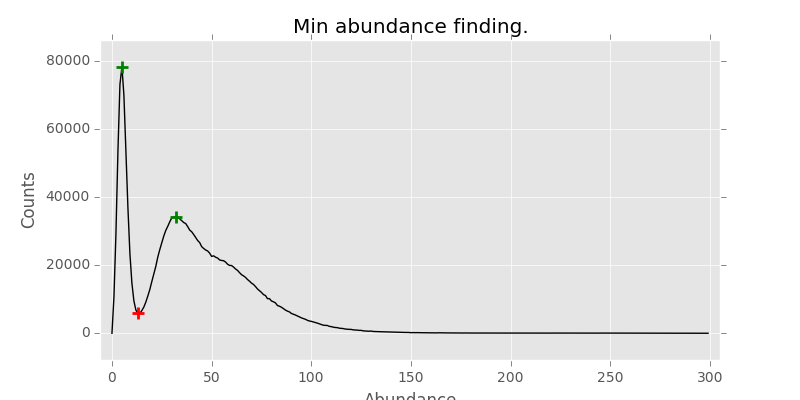
Conventional wisdom is that the first peak in the abundance are the errors in sequencing that happen in low abundance, but there are many of them. However, this graph shows that there is about 10-fold coverage of them! Hmm strange. Then I remembered that not everyone trims adapters, esp when there are issues with short fragment size and sequencer reads adapters on the other size of the read. Trimming with Trimmomatic helps with this straight away (ILLUMINACLIP:<TRIMMOMATIC_ADAPTERS_PATH>:2:30:10:8:true MINLEN:50):
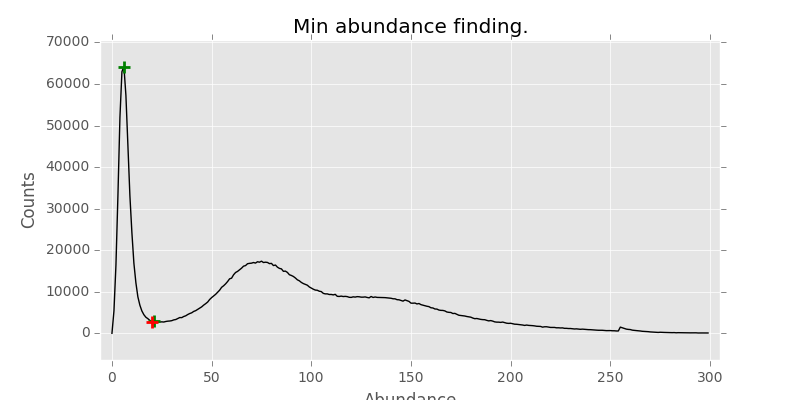
Sample where this is really bad:

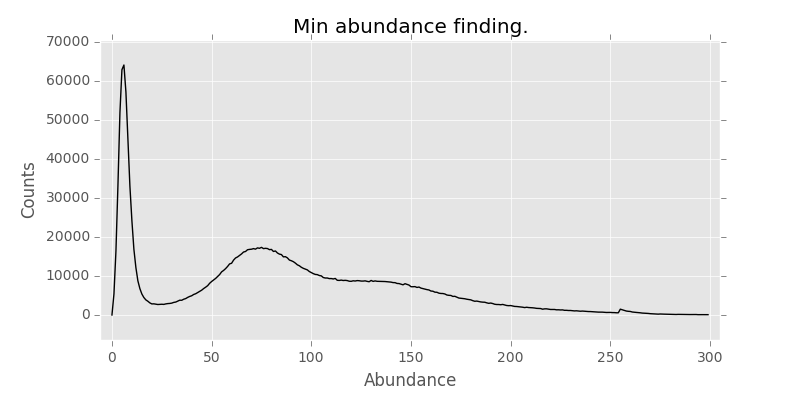
Now we want to exclude this huge peak by abundance, but this peak is going to be different for different samples. What we really want is to dynamically find the valley between the peaks for different samples. So we went to have a look at different peak/valley finding algorithms. There is a neat overview here. But which one is the best?
N.B> My thinking was to find 2 peaks then it is relatively simple to find the lowest point between the 2 peaks in python.
First I thought I would try continuous wavelet transforms (CWT). It’s a frequency space analysis tool, somewhat like Fourier transforms. It worked for this sample, but wasn’t great for some other samples.
I tried different width wavelet to capture wider peaks, but still was a mixed bags of results. Next one was Marcos Duatre’s peak finder. Hmm, sort of works, but again fails for other samples.
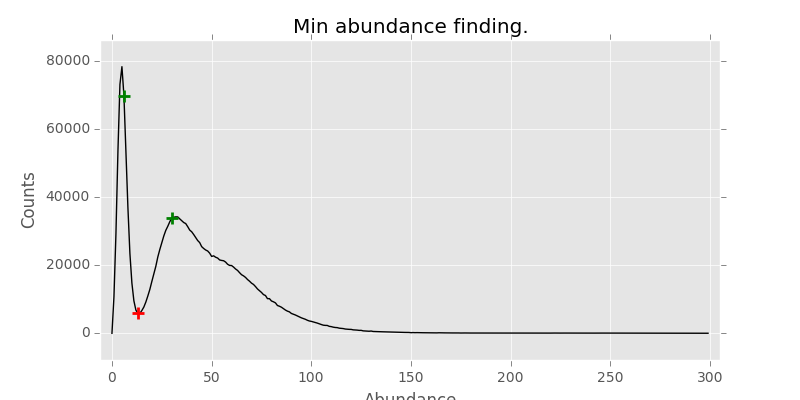
Tweaking with peak width and min distance between peaks didn’t resolve these issues. Then I thought to take a little simpler approach and found this function, converted from MATLAB code. Running on about 230 samples, every single one hit the right valley. Which I was happy with.
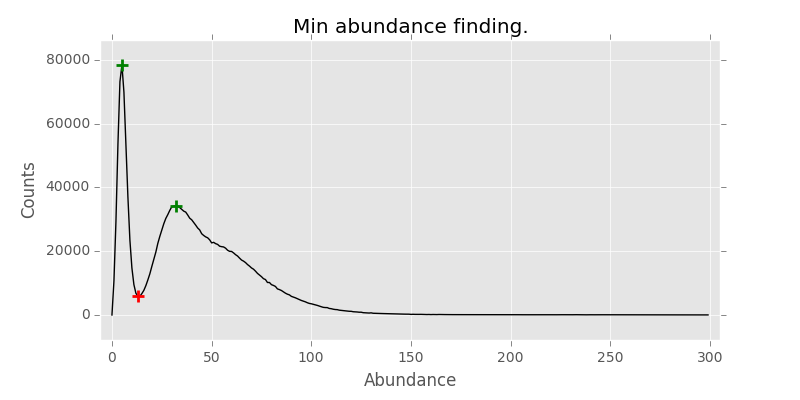
Now we can use min abundance finder to supply as -m parameter for MASH for dynamic sketch making, as long as it is the same kmer size used for counting. The code for this can be found here. the samples I used for this post can be found in SRA: SRR1796370, SRR1797652.


