TL;DR
- SKA is a high quality bioinformatics tool which enables you to rapidly do genomic epidemiology of very closely related isolates.
- SKA shows good correlation with traditional SNP calling techniques (BWA + GATK)
- SKA shows a consistent trend of identifying around 10 more SNPs between a sub-set of pairs of isolates than traditional method, I’m not sure why as yet (this could be something I’m doing, not the tool itself!)
SKA is a tool published a few years ago by Simon Harris. I’ve wanted to give it a go for a while, but haven’t really had any need for it.
However, I recently got a nanopore data set for an unusual serotype of Salmonella. I thought SKA was a suitable tool for this project because:
- It accepts assemblies not just reads (I haven’t validated SNP calling with nanopore data yet).
- It seemed like it would be quick to get off the ground
- It should be robust to indels in my assemblies (i’m expecting a few hundred artifactual indels because these are nanopore only assemblies, i’m only expecting a few hundred indels because they’re made from guppy5 super high accuracy basecalled data).
However, before trusting it on my novel dataset, I wanted to check how the tool performed on a known dataset, so I ran it on a Typhi dataset I have also processed in the “traditional” way (mapping to a reference with BWA, SNP calling GATK).
SKA was great to use, I had ZERO issues with the installation and running, which was a DELIGHT!
First I made the split kmer files using the ska fasta command (around 10s per sample, 5 Mbp Salmonella assemblies), and then use ska weed to remove split kmers which were present in the regions of the Typhi genome which we mask because they’re repetitive or are on phage etc. Then I aligned the remaining kmers against each other with ska align (about 5-10 minutes for ~170 samples). This produces an alignment file which can go straight into iqtree.
I should say that this is a very challenging dataset, because around 97% of the isolates belong to a single highly clonal Typhi sub-clade called H58 (or L4.3.1), which has a very low amount of diversity.
So, then I had two trees – one “traditional” and one “SKA”. How to compare them? I think ideally, I would use the Kendall-Colijn metric on 100 or 1000 of the best trees from the IQTREE analysis. However, I don’t have the commands to do this at my fingertips, even though it’s been on my todo list for a while. So I went for quicker, dirtier and more familiar approaches. Thoughts on more prinicpled ways to do this very welcome!
The three methods I used to compare the results are:
- ete3 compare
- dendroscope tanglegram
- comparison of SNP pair wise distance in the alignment.
Results
ete3 compare said that 69% of the branches between the trees were the same, which seemed reasonable to me, considering the difficulty of resolving phylogenies in the absence of much diversity.
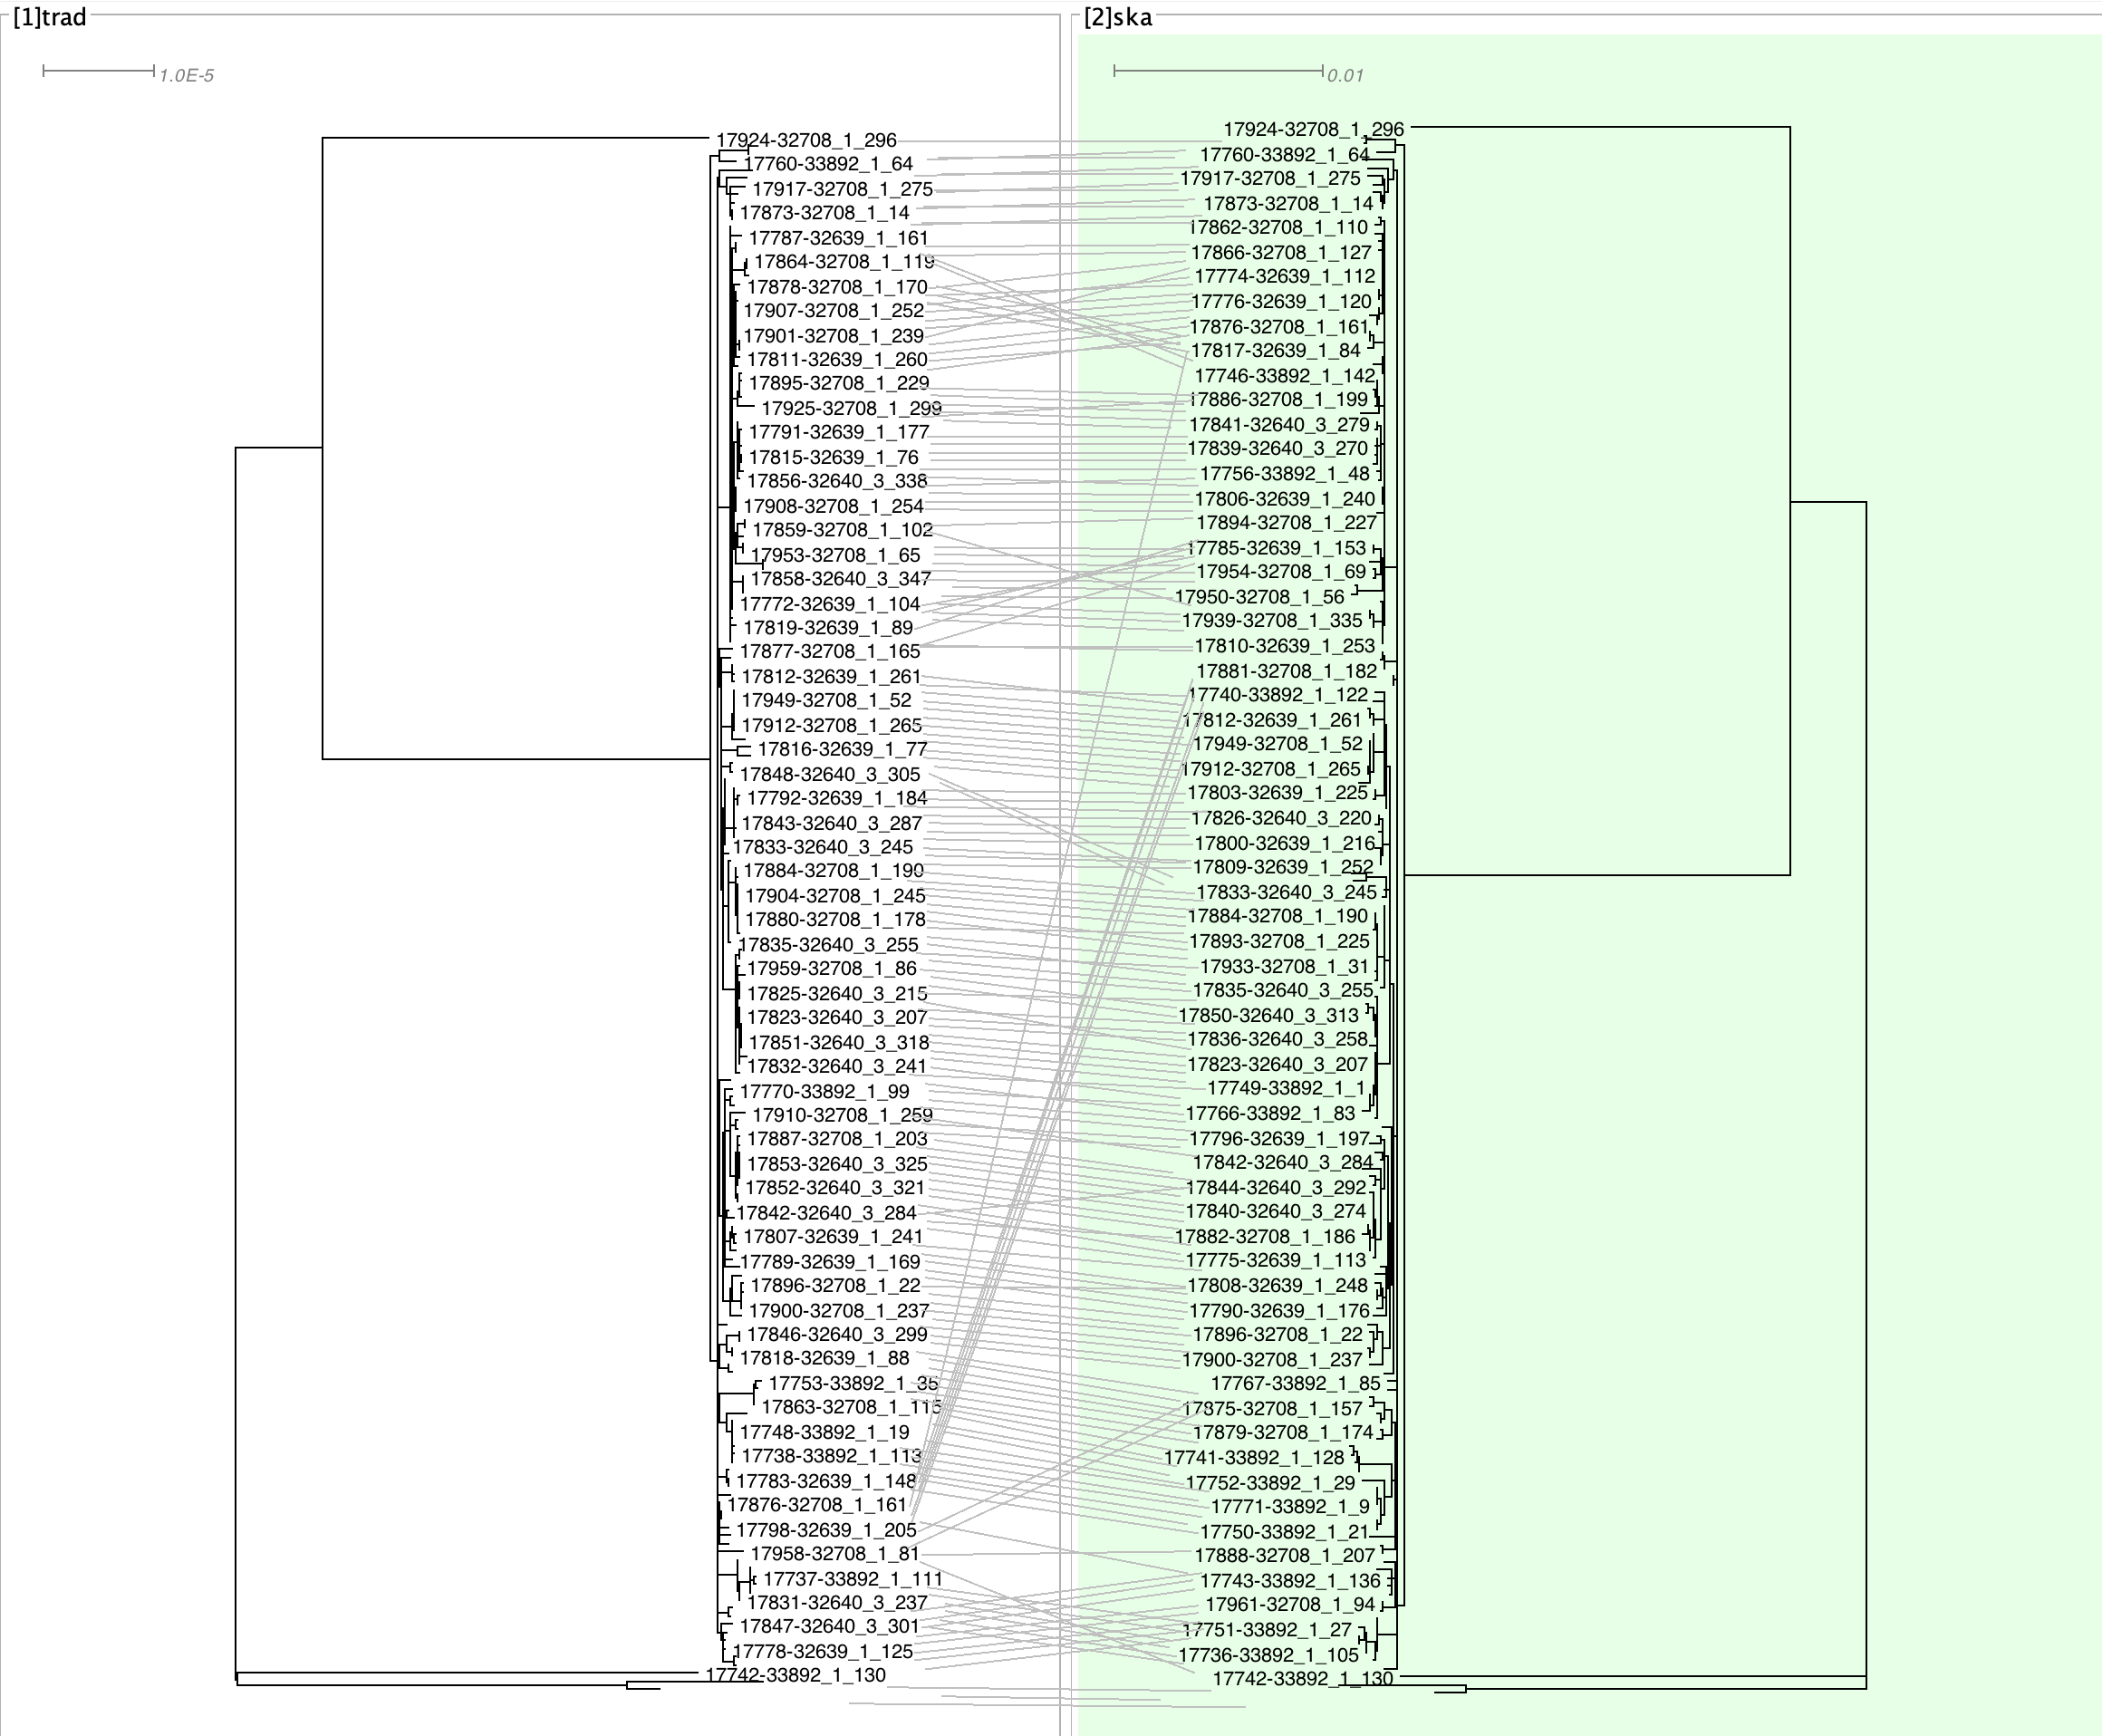
The tanglegram also seemed largely very reasonable. Most of the big switches seem to be in areas which are basal to the H58 clade (the big flat clade accounting for most isolates), and so shifts here are not unexpected.
And finally, the pairwise SNP distance of the two methods. Which showed good overall linearity.
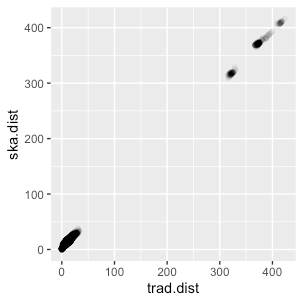
Comparison of pairwise SNP distance identified by the two methods showed good linearity.
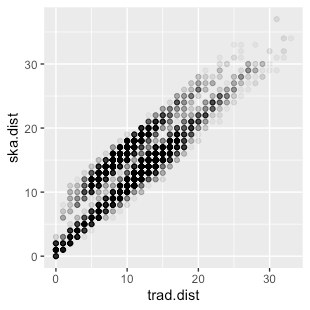
However, if we zoom in on the close SNP distances, we can see a “double line”. One through the line of identity, which is what we would expect from a nice agreement between teh two methods, and the other where the ska distance is about +10 on the traditional distance. This seems very consistent trend (SKA identifying about 10 more SNPs between isolates than the traditional method), and probably has some sensible explanation which I haven’t figured out yet.