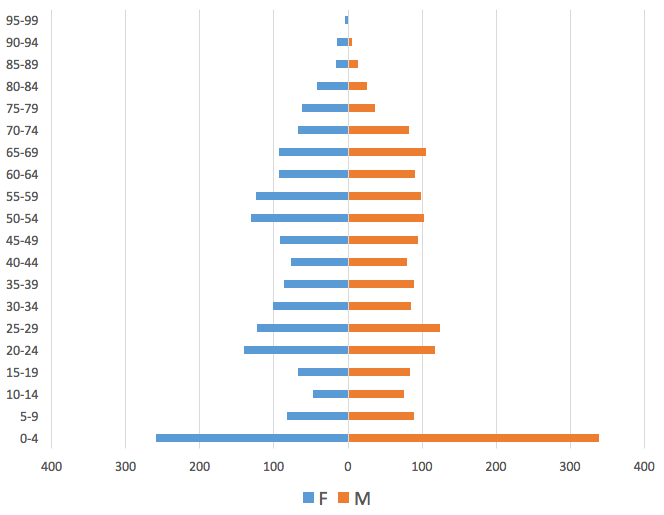
Say you have an age-sex breakdown and you want to summarise it in the usual way (as below). how do you do this in excel?
this is definitely a post from the annals of ‘so ridiculous i had to write it down’.
So, you have to give one of your sexes minus values, and then do a stacked bar chart with both. Then, to get rid of the minus values on your axis, you have to go fishing around in the axis options (probably in the ‘number’ section), for something like ‘format code’. Then, set the format code to be ‘0;0’.
Don’t ask me why, it’s just mental. Add this to the list of reasons to get more familiar with R.
p.s. if anyone has code to do this in r, would be greatly appreciated.


