As a bioinformatician, I spend a lot of time generating, interpreting and presenting trees.
One of the most powerful ways to get some added value out of a tree is to be able to compare the phylogeny with the accessory gene content, to see if there is something going on with the mobile genetic elements that isn’t reflected in the core genome tree.
Kat Holt has a great post on different ways of doing this, and I recently got up and running with one of those methods and thought I would write it down before I forgot.
The method is ete2, a python library produces nicely annotated trees.
First things first, installation. It is not straightforward because there is a GUI element which requires a program called QT, a widely used and powerful GUI engine/design tool. However, as in many things brew makes life simpler. If the instructions on the ete2 guide don’t work for you, try this instead (more details on this site).
brew install qt (takes a while)
brew install sip
brew install pyqt
You will also need to ‘brew install mysql’ and ‘pip install MySQL-python’ if you don’t have this already.
Then you can ‘pip install ete2’ and you should be golden!
Then, run something like this (which my colleague Alex Jironkin wrote), setting heatmap = ‘path/to/heatmap’ and tree_file = ‘/path/to/treefile’.
There are a few gotchas, namely that the order of the heatmap must be the same as the ordering in the tree, and as Kat Holt pointed out, if you want the tree to be ladderised, you will have to do this in e.g. figtree and then export the tree with the ‘saving as currently displayed box’ ticked.

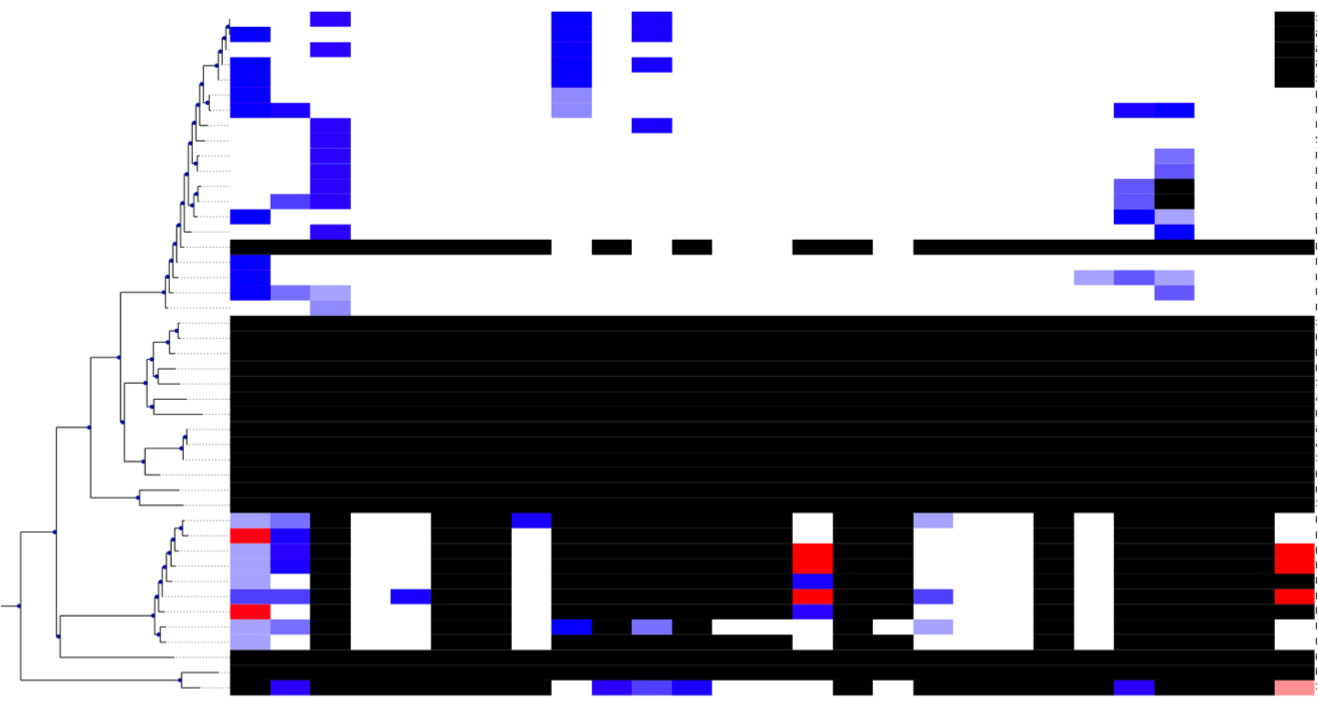
Then, hopefully, when you run Alex’s script, a GUI will open containing something like the above (white = presence, black = absence, blue-red something in between), with your tree and associated features of interest. Hooray!


hi! just a few tips: 1) once you import your tree using ETE, you can ladderize or sort the branches just by doing tree.ladderize() or tree.sort_descendants() 2) python-mysql is an optional dependency used only by a couple of side modules, so you can skip that dependency 3) Also, check this post for a workaround providing a portable ETE version (including Qt): http://phylohack.wordpress.com/2014/11/01/a-portable-version-of-the-ete-toolkit/
Hi! Thanks for your comment. Would be very interested in any other tips you have – for example, are the different colour schemes documented anywhere?
If you want to stick to the ClusterTree implementation, I am afraid the three color schemes are hardcoded (although this is a workaround: https://groups.google.com/forum/#!msg/etetoolkit/_3adcV-rBec/TT9dfodkd1EJ). However, that’s too complicated, I would say that to have better control on the heatmap generation, you can just use a basic Tree instance, create your own layout function and add as many RectFace instances in aligned position as you need. Then you have full control of sizes and colors. RectFace is undocumented yet, but very simple to use (from ete2 import RectFace). I should maybe write about this in more detail at some point. I see many people interested 🙂
Great, good to know!
FYI: easy examples on customizing heatmaps and adding column header using ETE: https://groups.google.com/d/msg/etetoolkit/UZSGxdTIaRQ/fiRI1n0nqZgJ