I have a new job! A couple of weeks ago I became a permanent employee of PHE. This new role will mean a shift from VTEC O157 to Salmonella.
We have sequenced 1500 strains of Salmonella from diverse serotypes to validate serotyping via MLST (see Achtman et al., 2013 for more details). This is prior to the routine sequencing of Salmonella that will begin in 2014.
Since this project is going to be rumbling on for a while, we are keen to start with cutting edge tools so that we can stay relatively current for the next few years. For this reason, we are looking at updating our mapping tool from BWA (aln and sampe) to BWA mem.
TL;DR summary:
- BWA-mem gives very similar results to BWA aln/sampe
- There are some differences, which tend to be a result of aln/sampe mapping (dubiously?) where mem does not.
- There are also some areas where mem maps to that aln/sampe does not.
- This is not an exhaustive analysis but should provide additional re-assurance, alongside with Heng Li’s recommendation to use mem for reads > 70 bp, if you want to make the switch to BWA-mem.
I used BWA-mem to map 51 strains of Salmonella Enteritidis to a reference. These strains have been previously mapped using BWA-aln/sampe. After SNP calling with GATK, I have loaded the vcf files into our SNP database (philosophically similar to the snp-search approach, some differences in implementation) and have been comparing the results.
So, first of all, what is the correlation in terms of the number of variants and number of ignored positions between the two algorithms?
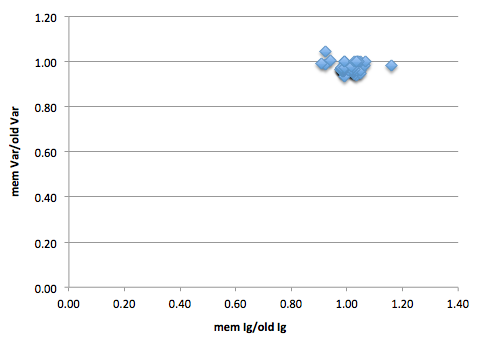
Figure 1: Y-axis is number of BWA-mem variants proportional to the number of ‘old’ (BWA aln/sampe) variants. As mostly below 1, can see that mem is resulting in fewer variants. X-axis is same but for ignored positions. There are 51 strains in this graph.
The tight clustering around 1 on both axis of figure 1 shows that the algorithms result in similar numbers of variants and ignored positions. However, are these the same variants and ignored positions?
I parsed the variant position lists from the mem and ‘old’ using a python script that grabs these from our SNP database and then outputs all the variants called on the mem mapping and the old mapping and those that are unique to mem and unique to old.
Then I used a default dictionary to parse these unique lists for all 51 strains to see if there were certain variants that were consistently called when bwa-aln/sampe or mem was used as mapper. Turns out there was!
So, as was intimated by Figure 1, it was generally variants being called on bwa-aln/sampe mapping that were not present in the mem alignment (although there were a couple of exceptions).
There were 367 variants that were present in more than two strains in the aln-sampe mapping that were always missing from the mem mapping. However, the majority of these variants were only present in a couple of strains. There were 21 variants that were ided in 10 or more strains using aln-sampe was used that were not present in any strain when bwa-mem was used.
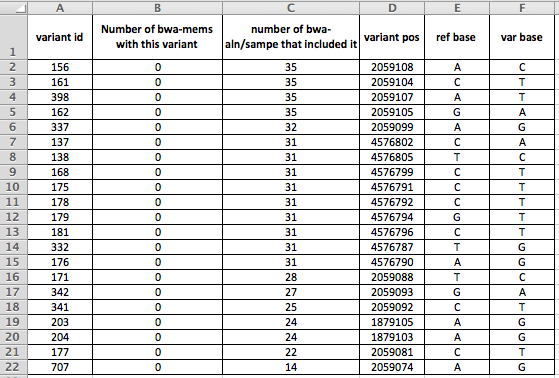
Figure 2: details on the 21 variants present in more than 10 strains by aln-sampe that were absent from all bwa-mems. variant id is a SNP database attribute, variant pos is the position of the variant in the O157 Sakai genome we use as reference, ref base is the nucleotide in the reference, variant is what it changed to.
So, if you look at Figure 2, you can see that the variants cluster by position. What do these locations look like when we visualise them using e.g. Tablet? (which I think is my favourite piece of bioinformatic software to use).
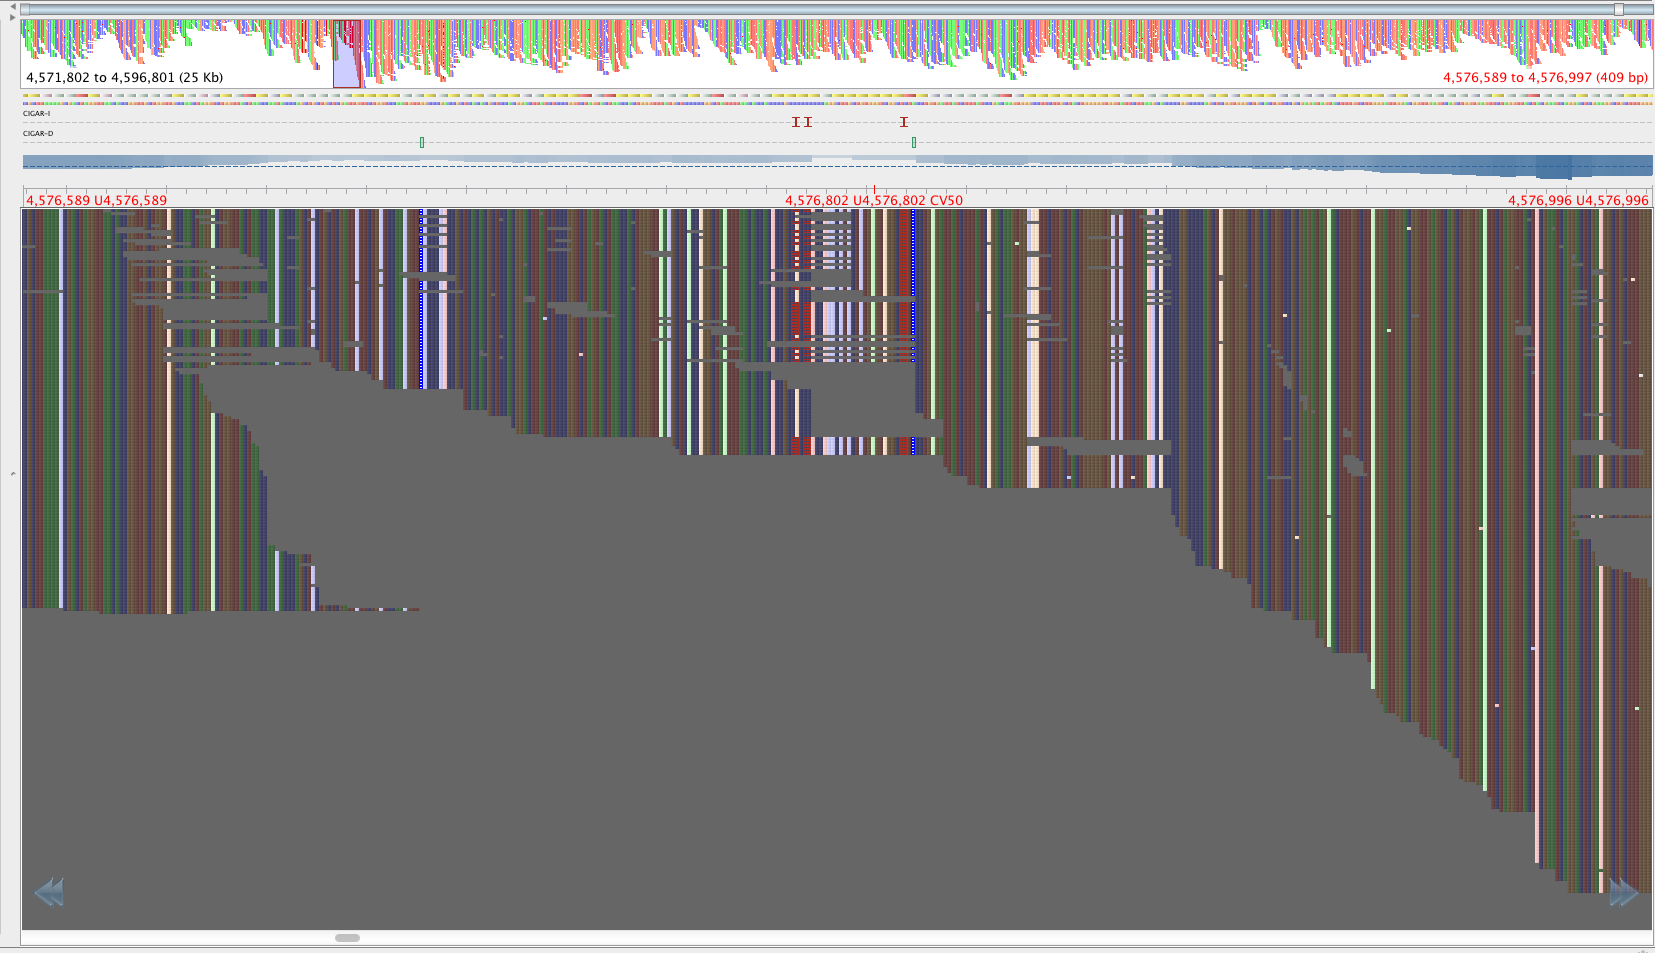
Figure 3: Region with the 2059108-2059104 SNPS, aligned by BWA aln-sampe. Red lettering above region of interest.
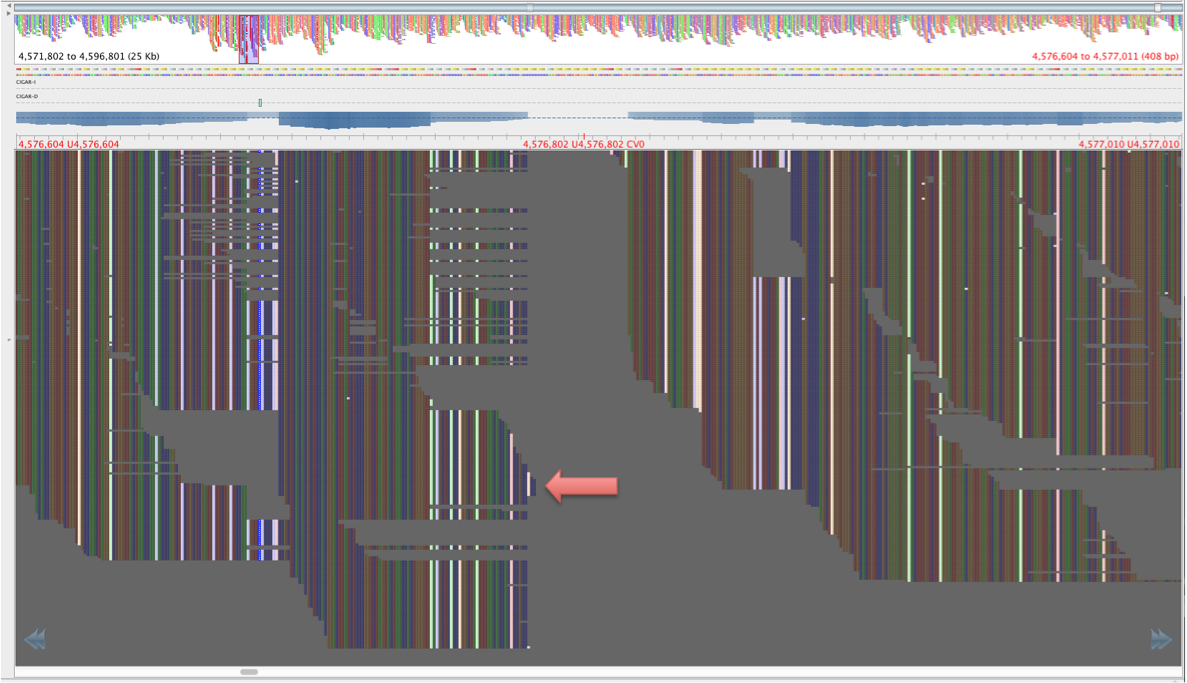
Figure 4: Same region as figure 3, aligned by BWA-mem, red lettering in same place.
The reads in figure 3 that map where there is no mapping in figure 4 have mapping quality of about 23 and a genotyping quality of 93. The genotyping quality is high enough to pass our threshold but fortunately, the mapping quality is not. Therefore, these variants are ‘ignored positions’ and don’t contribute to our phlyogeny. There is also an example of an extra bwa-mem SNP in figure 4 compared with figure 3, which is highlighted with a red arrow.
This following example will have influenced the phylogeny though.
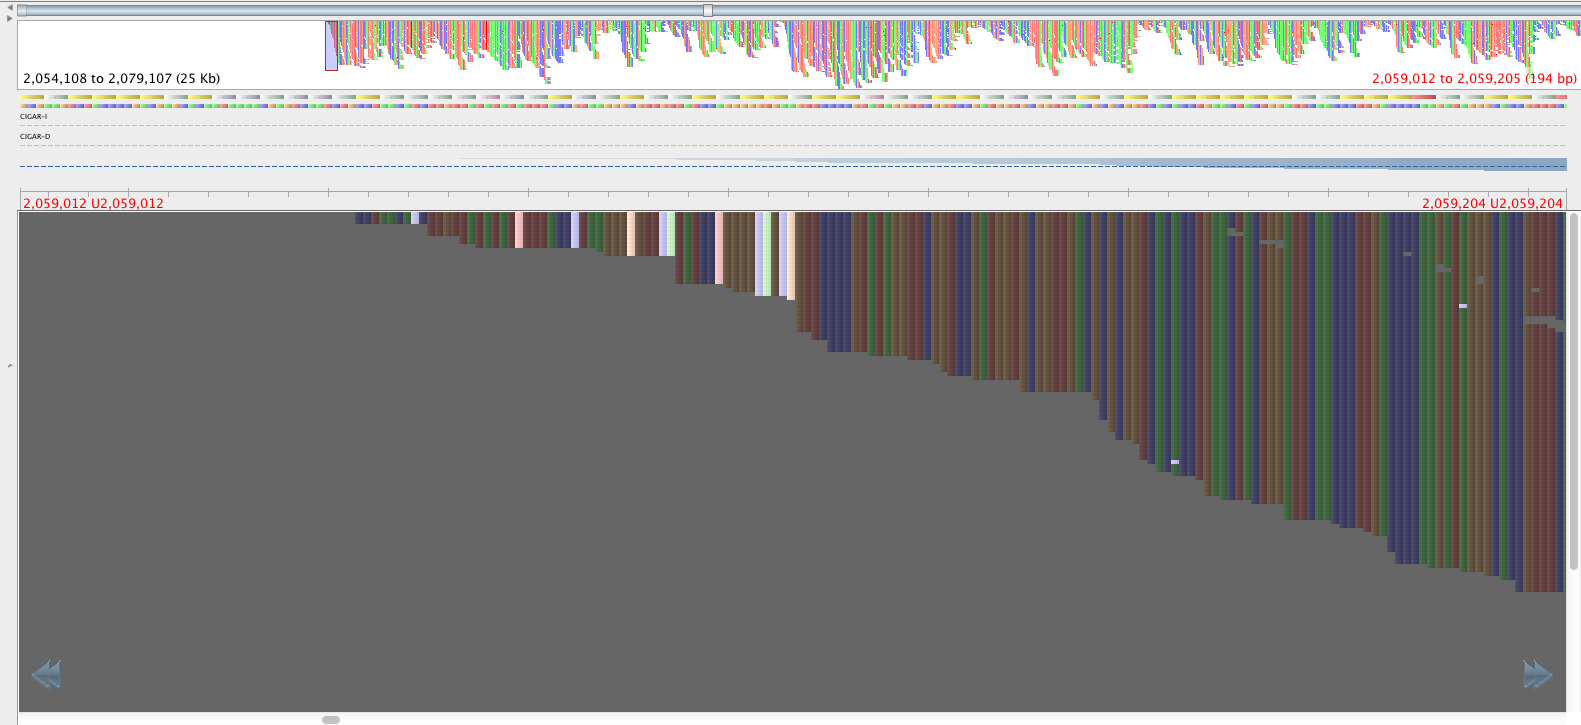
Figure 5: A BWA-aln/sampe mapping, some of these SNPs pass both mapping and genotyping quality thresholds.
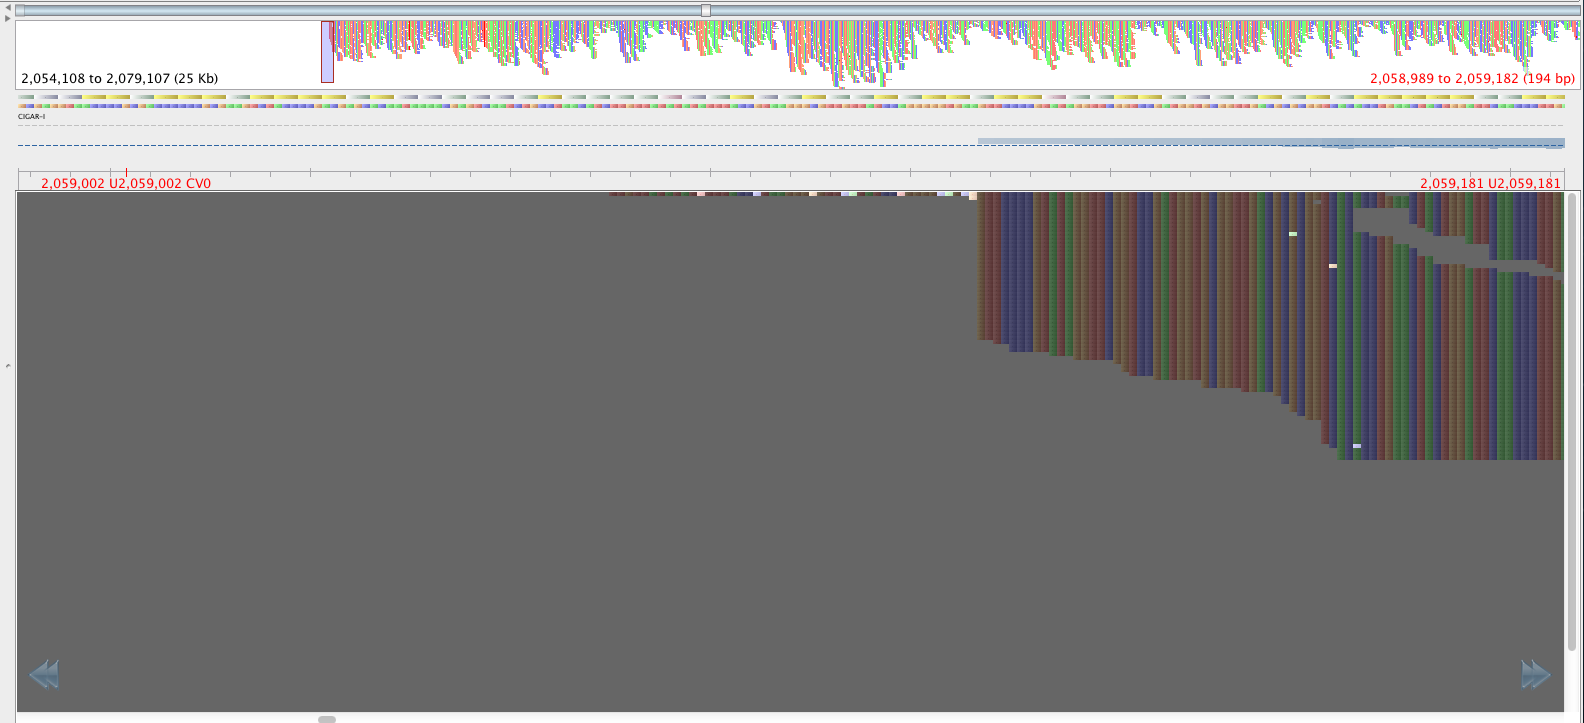
Figure 6: The same region as figure 5 but aligned with BWA-mem. Only one read with lots of variants has mapped.
The region shown in figures 5 and 6 is the edge of a prophage and variants in this region probably shouldn’t contribute to the phylogeny, so that is a win for BWA-mem. Although, whether or not we want the variants in the aln/sampe mapping is not a clear cut issue – they do, after all, pass our mapping and genotyping thresholds. However, the large number of SNPs in this region, compared with the surrounding regions indicates that these SNPs are not the result of genetic drift. Could probably write a whole other blog post exploring this issue…
So, how does this variation effect phylogeny?
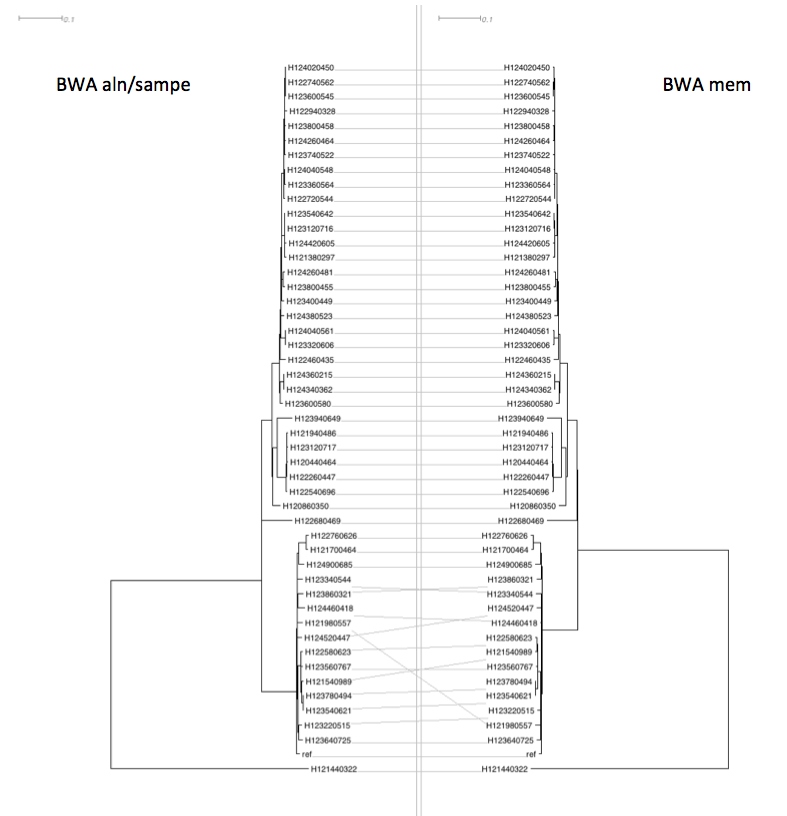
Figure 7: Effect of the different mappers on phylogeny – dendroscope tanglegram
The effect on phylogeny (as computed by Fasttree) is pretty minimal, with some mild jiggery-pokery on some of the more poorly supported branches but very similar overall and very similar branch lengths.
So, in summary, check out the tl;dr at the start.


Pingback: How to do a Dendroscope tanglegram – Bits and Bugs